See web sites: Share the Wealth and paywatch.
 See web sites: Share the Wealth and paywatch. |
U.S. Income
Distribution & Class Structure
|
 Holly
Sklar's article in Z Magazine follows:
Holly
Sklar's article in Z Magazine follows:The Children's Defense Fund's S.O.S. America! A Children's Defense Budget says it would have cost $26 billion to bail children and families out of poverty in 1988 and under $54 billion to eliminate all poverty. That's far less than the price of bailing out S&Ls, "defending" Europe against a defunct Soviet bloc, or providing tax breaks and income redistribution for the rich. According to Harvard economist Robert Reich, were the personal income tax as progressive as it was in 1977, "in 1989 the top tenth would have paid $93 billion more in taxes than they did. At that rate, from 1991 to 2000 they would contribute close to a trillion dollars more, even if their incomes failed to rise" (Atlantic Monthly, February 1991).
The demon deficit is a self-fulfilling prophecy of the rich to insure their luxuries and war machine over the necessities of the many. It is a deficit of humanity, not money.
The Robber Barons
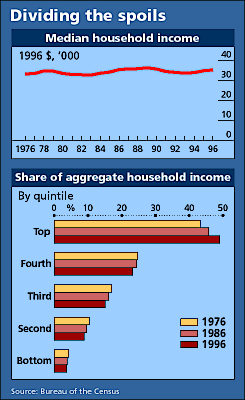
Between 1950 and 1970, income disparities narrowed in the United States. Since then disparities have been growing at a quickening pace. While wealthy households are taking a larger share of the national income, the tax burden has been shifted down the income pyramid, through cuts in the top personal income rates, capital gains, and increases in regressive social security and excise taxes.
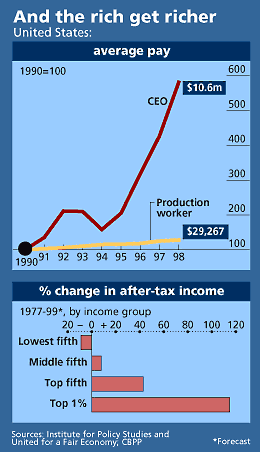
"The growth in the incomes of the richest one percent of Americans," observes the Center on Budget and Policy Priorities, "has been so large that just the increase between 1980 and 1990 in the after-tax income of this group equals the total income the poorest 20 percent of the population will receive in 1990." The gap between the wealthy and the middle class has widened such that "in 1980, the total amount of after-tax income going to the 60 percent of households in the middle of the income spectrum...was 12 percent greater than the income going to the wealthiest fifth of households. By 1990, however, the income going to the middle three-fifths will be seven percent less than that received by the top fifth...Census data indicate that the gaps between both the rich and the poor and the rich and the middle class are wider now than at any other time since the end of World War II."
As the Children's Defense Fund's Marian Wright Edelman puts it, "We face a crisis of economic injustice . . . From 1982 to 1989, the number of U.S. billionaires quintupled while the number of children who fell into poverty increased by 2.1 million," (Mother Jones, May/June 1991).
But don't the rich give away income? Actually, the rich give relatively little and what they do contribute saves them in taxes and remits largely to their own class. A 1987 study by Yale University's Program on Non-Profit Organizations found that "most high income Americans are modest to stingy givers and only because a tiny minority are exceptionally charitable do the wealthy have a reputation for generosity," (The Non-Profit Times, November 1987). Robert Reich notes that "most voluntary contributions of wealthy Americans go to the places and institutions that entertain, inspire, cure or educate wealthy Americans--art museums, opera houses, theaters, orchestras, ballet companies, private hospitals and elite universities."
In 1990, households with incomes of less than $10,000 gave an average of 5.5 percent of their earnings to charity or religious organizations; those with incomes above $100,000 gave only 2.9 percent. Also compare the 1960s with the 1990s: which was the better decade, economically?
national |
|
| change |
Net Worth, |
| |
poorest 20% | $7,357 | $6,973 | $-384 | -5.2% | bottom 80%: bottom 95%: | |
next poorest 20% | $16,088 | $16,124 | $36 | 0.2% | ||
middle 20% | $24,031 | $24,691 | $660 | 2.7% | ||
next richest 20% | $32,075 | $34,824 | $2,749 | 8.7% | ||
richest 20% | $58,886 | $78,032 | $19,146 | 32.5% | ||
|
|
|
|
| ||
richest 5% * | $100,331 | $151,132 | $50,801 | 50.6% | 61.4% | |
| richest 1%** | $213,675 | $399,697 | $186,022 | 87.1% | 39.1% | |